What Is Statistics?
Statistics is a science that collects, analyzes, and interprets data to reveal patterns and support decision-making, widely applied in medicine, economics, social sciences, and more.
Isaac Turner
Jan 3, 2025 13 mins read
Statistics is an area of mathematics that deals with collecting, analyzing, interpreting, and organizing data in an orderly fashion for decision-making purposes. Statistics is invaluable for summarizing large datasets efficiently; its methods help us detect patterns or trends as well as test hypotheses with confidence. Statistics has applications in numerous fields like science, medicine, economics, engineering, and social sciences, where it helps make sense out of numbers to form meaningful insights that provide tangible answers and deliver useful outcomes.
Definition
Basic Concepts
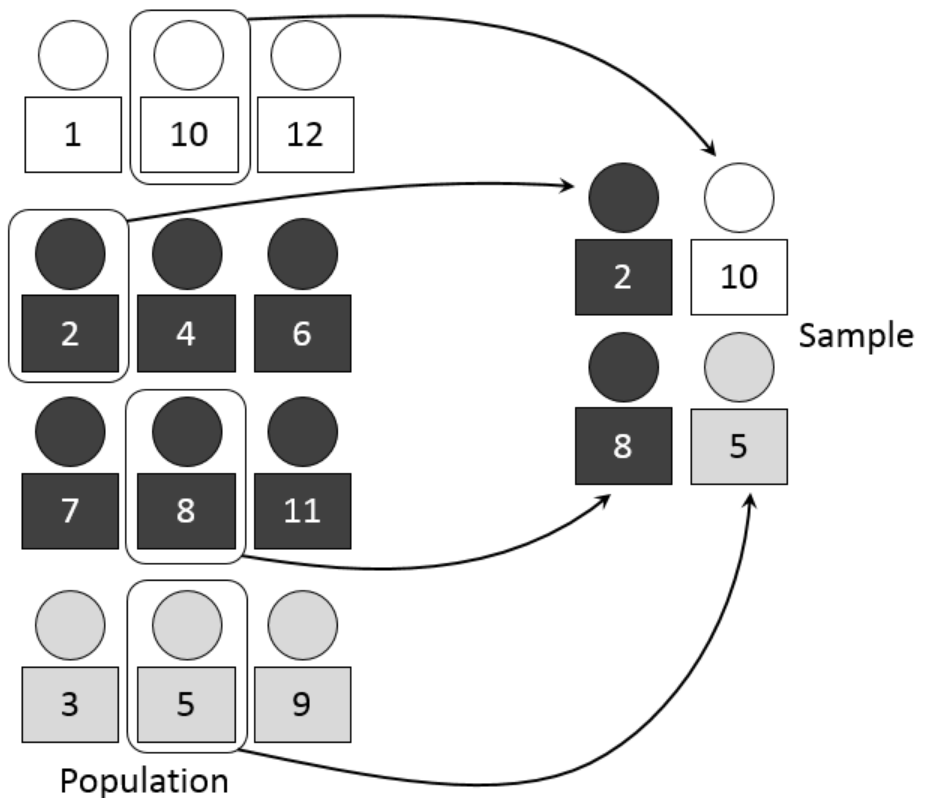
Statistics is built upon several foundational concepts that form its core. At its center are populations and samples; populations refers to all entities being investigated, while samples refers to subsets from this population chosen specifically for analysis. Variables are characteristics or properties with variable values; data refers to actual measurements for these variables. Understanding these concepts is integral for statistical analysis and interpretation—for instance, in medical research projects where populations might consist of all patients suffering from one condition while samples would represent randomly selected participants who agreed to take part. Variables could include age, gender, and treatment outcomes of these selected patients as examples.
Key Points
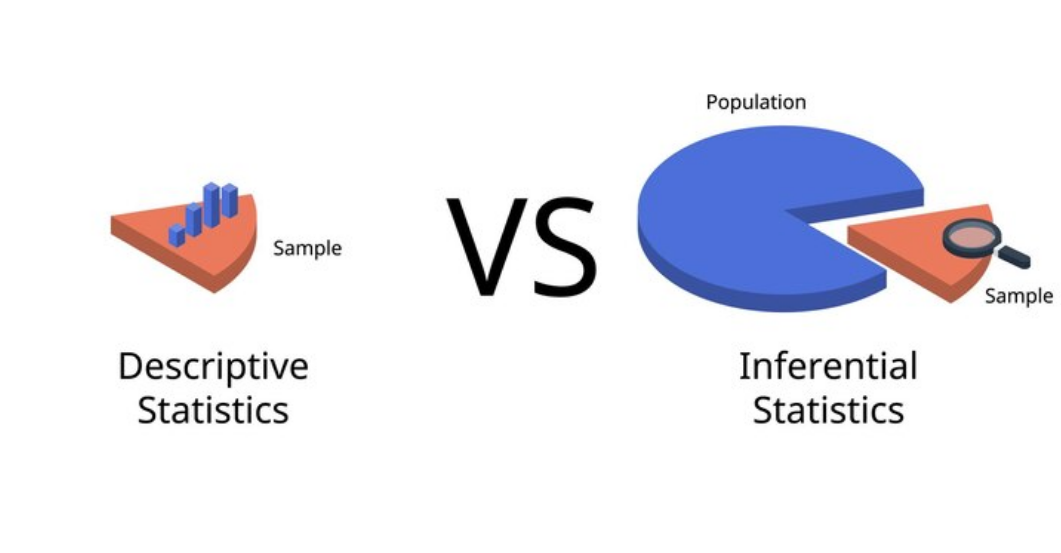
Understanding the difference between descriptive and inferential statistics is vital. Descriptive statistics sum up and describe features of a dataset through measures like mean, median, and standard deviation; on the other hand, inferential statistics use sample data from one population as generalizations about another by employing techniques like hypothesis testing and confidence intervals. Also essential in inferential statistics are statistical significance tests, which help establish whether observed effects could simply be due to chance. Finally, confidence intervals provide ranges within which population parameters might fall and can serve as measures of precision estimates of population parameters from estimates alone.
Necessity of Statistics

Statistics is essential in an uncertain, complex environment as a means of making sense of data, from economic trends forecasting, drug effectiveness evaluation, and improving manufacturing processes, through to testing hypotheses based on sample data analysis. With data-driven decisions, organizations can optimize operations while decreasing risks and improving outcomes.
Typical Examples
Statistics in action include polling, clinical trials, and quality control processes used in manufacturing. Opinion polls use statistical sampling techniques to survey public sentiment on various issues; clinical trials use statistics as part of their methodology in order to assess efficacy and safety evaluation for medical treatments; quality control processes use statistical tools in manufacturing to monitor product quality by monitoring defects reduction while increasing consistency—all examples that showcase how statistics is employed across fields to solve real-world problems while increasing decision-making capabilities.
History of Development
Origin Process
Initial Discussions
Statistics has its roots in human efforts to collect and analyze data for administrative or governmental use. Ancient civilizations such as Egyptians and Babylonians kept records of agricultural production, population counts, and trade activities primarily to use for taxation or resource allocation; over time this form of collecting and analyzing data gradually evolved, eventually giving way to formal statistical methods.
Gaining a Name

Statistic was coined during the 18th century from the Latin word status (state or condition), initially used to refer to data collection about states and their resources. Early statisticians, like John Graunt, who conducted mortality analyses in London, and William Petty, who conducted economic surveys, helped establish statistics as an independent field of study, demonstrating their significance as pioneers utilizing systematic data collection and analysis in understanding and managing societal problems.
Mathematical Foundations
Statistics was first founded mathematically during the 19th century with the establishment of probability theory and statistical inference by mathematicians such as Pierre-Simon Laplace and Carl Friedrich Gauss; their contributions provided a framework for understanding random events while Gauss developed his method of least squares for data fitting purposes—both developments leading to formalizing statistical methods used across diverse scientific and practical applications.
Modern Statistical Development
Three Waves of Development
Modern statistics has developed through three main waves: classical statistics, Bayesian methods, and computational statistics. Classical statistics primarily focused on developing methods for hypothesis testing, estimation, and regression analysis, while Bayesian techniques introduced probability distributions as a means to represent uncertainty and update beliefs as data arrives. Computational statistics leverages advances in computing power to handle large datasets and perform complex analyses more easily—these waves have broadened both the scope and capabilities of statistical methods while making them more versatile and powerful than ever.
Main Content
Classification
Descriptive Statistics
Descriptive statistics offer an in-depth and accessible look at any dataset, providing a concise summary. Key measures of descriptive statistics are central tendency (mean, median, and mode), variance (range, variance, standard deviation, and standard deviation), and distribution and spread (for instance, when considering exam scores, the median indicates the middle score while the standard deviation shows how scores fluctuate around it). Descriptive statistics can serve both initial data exploration as well as communicating basic details regarding it to others.
Inferential Statistics
Inferential statistics use sample data from one population to make generalizations about all populations, using techniques such as hypothesis testing, confidence intervals, and regression analysis to draw generalized conclusions and predictions about them. They're particularly useful in medical research where inferential statistics help researchers ascertain a new treatment is effective based on patient samples. By analyzing said sample data, they can infer likely effects it would have on the wider population; such techniques provide key decisions and predictions when collecting complete datasets is impractical or impossible.
Metrics
Mean
The average, or mean, is a measure of central tendency that provides one central value that represents all data in a dataset. To compute its value, all points must be added up and then divided by their number to find its center point. While useful for understanding an overall level in a dataset, such as income levels or demographic data sets, extreme values (outliers) might skew its result, giving a false impression of what the typical income levels should be.
Median
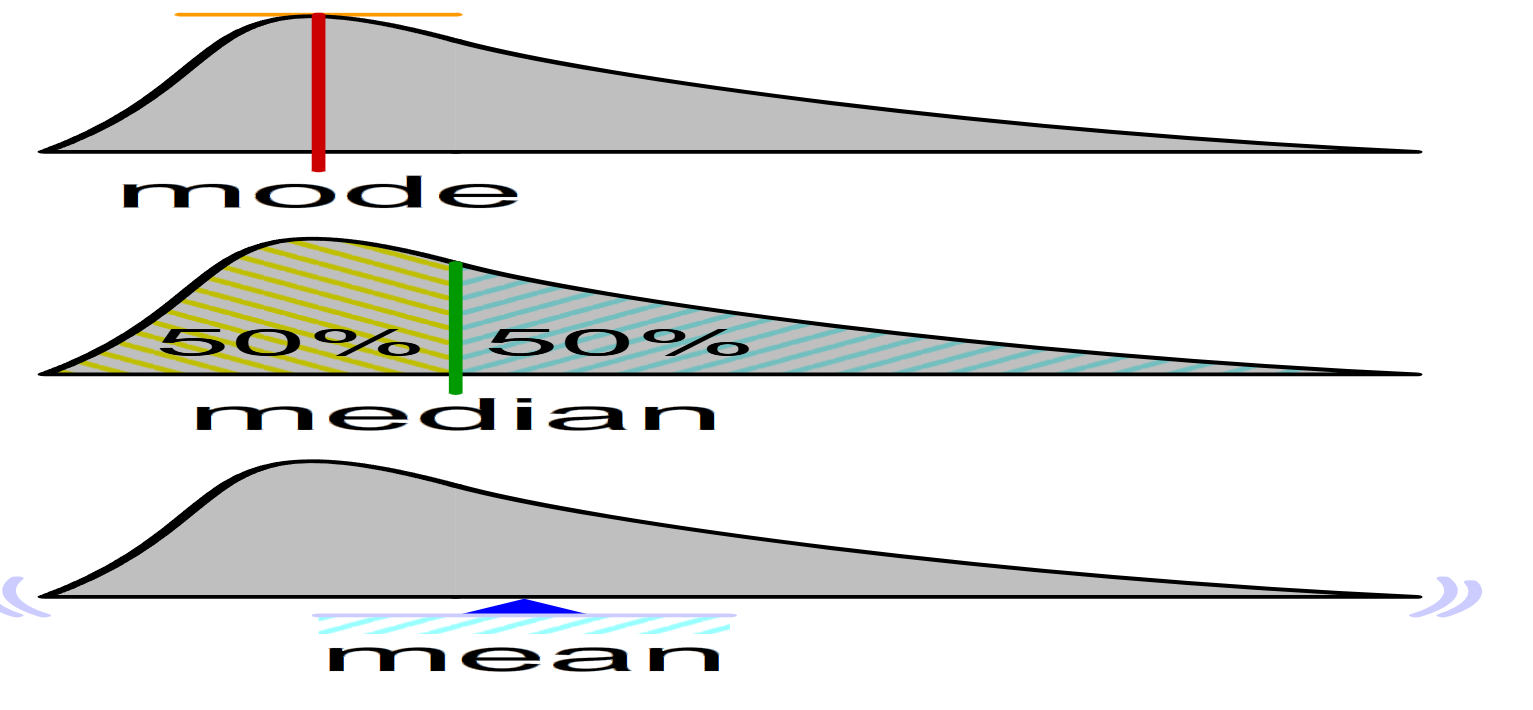
The median is the middle value in an ascending order dataset and acts as an indirect measure of central tendency that is less affected by outliers than its mean equivalent, such as house prices, where median prices often provide better indications than the mean of typical house costs if there are some exceptionally expensive properties among them. Its use becomes particularly advantageous when working with skewed distributions.
Mode
The mode is the value that most often occurs within a dataset and acts as an indicator of central tendency; for instance, in a survey about preferred ice cream flavors, it would be the flavor chosen by most respondents that would serve as its representative mode value. Useful for categorical data as it highlights typical values within it while still remaining distinct, multiple modes (bimodal/multimodal) or no modes at all can exist depending on whether all values in it have unique attributes or not.
If you want to find related practice questions, you can visit UpStudy's Study Bank.
Types of Variables
Qualitative Variables
Qualitative (or categorical) variables describe categories or groups such as gender, color, or brand preferences. They tend not to be numeric variables and are used to classify data into distinct groups—for instance, survey responses about favorite colors, such as red, blue, and green, are examples of qualitative data collection that is typically non-numerical in nature. Analysis of qualitative data involves counting frequency counts per category while using visual tools like bar charts or pie charts for the display of the distribution of categories.
Quantitative Variables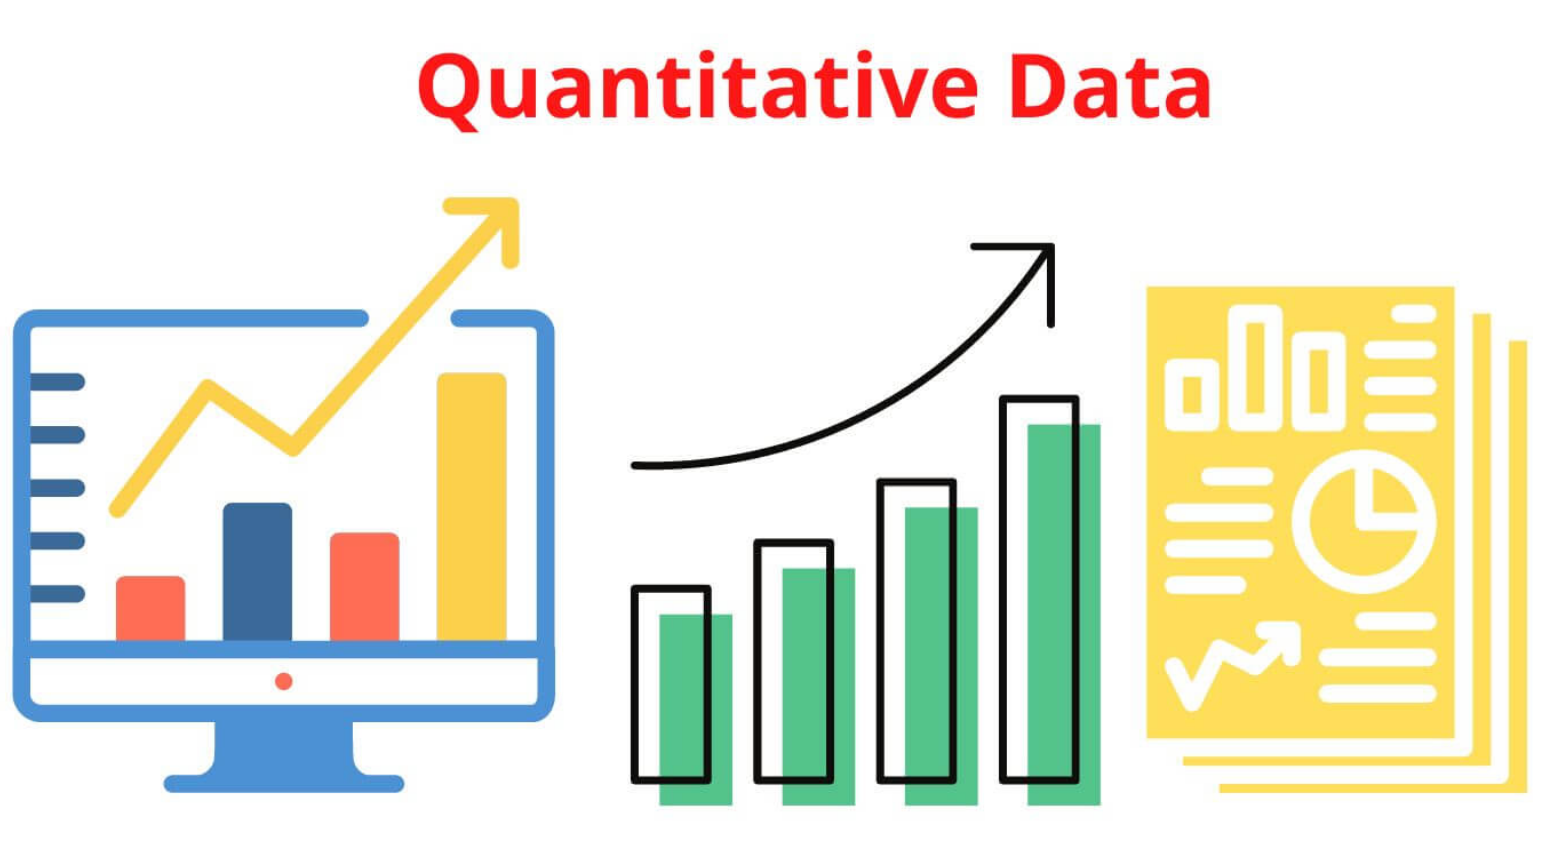
Quantitative variables represent numeric values that can be further divided into discrete and continuous categories, measuring numerical scale measurements on which to perform mathematical operations such as adding. Height, weight, and age are examples of quantitative variables, while conducting a quantitative data analysis typically involves measuring central tendency and variability and performing statistical tests to identify relationships and patterns among data points.
Discrete Variables
Discrete variables take on specific values that can only take the form of integers, such as children in a family or cars in a parking lot. Because discrete variables only allow distinct, separate values to take their place and can only ever take on distinct, countable ones (like students in a classroom), discrete data analysis frequently involves counting and categorizing frequency for every value present in a discrete data set.
Continuous Variables
Continuous variables, like height, weight, or temperature measurements, can take any value within their range, such as height. Continuous measurements take an infinite number of values within any range. Individual height can fluctuate continuously over time, with any level of precision being possible when taking this approach; analysis often involves calculating means, variances, and performing regression analysis in order to understand relationships among variables.
Levels of Measurement
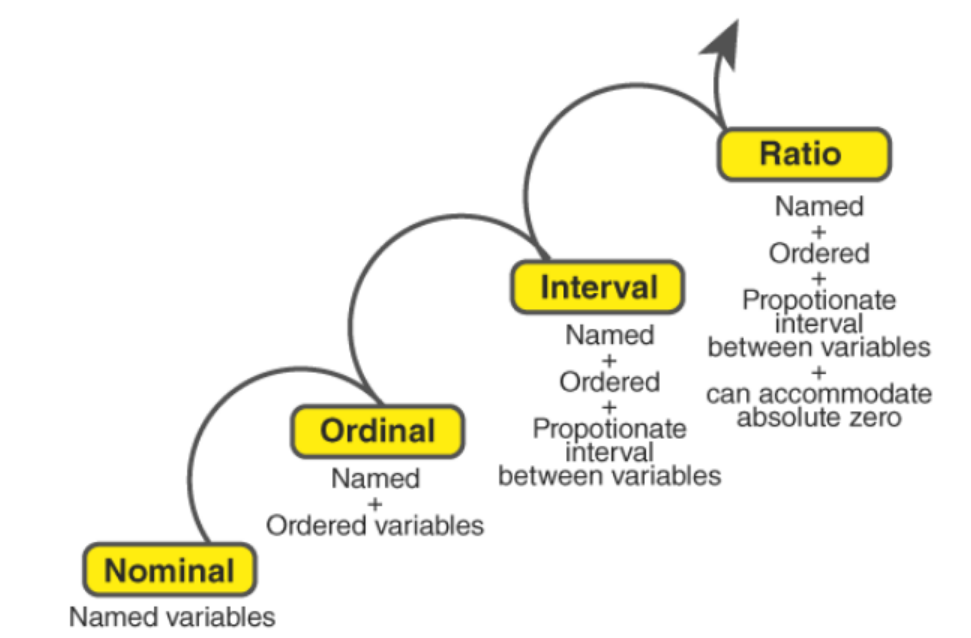
Nominal Level Measurement
Nominal measurement classifies data into distinct categories without assigning specific rankings to them; each category stands on its own and cannot be ranked; examples of nominal variables include gender (male or female), blood type A through O, gender of person measured, etc. Nominal data analysis involves counting frequency counts per category with bar charts to display distribution patterns of categories used as graphic displays to reveal distribution data; nominal level measurement provides another approach for qualitative data.
Ordinal Level Measurement
Ordinal measurement classifies data into categories in a meaningful order without consistent differences among them; for instance, education levels such as high school, bachelor's, master's, and doctorate are ordinal variables, as their categories can be ranked without consistent variations between them. Ordinal data analysis involves ranking the data using measures like median and mode to describe distributional trends; ordinal level measurements can also be applied to qualitative data that follows natural order patterns.
Interval Measurement
Interval measurement involves categorical variables with consistent differences between values but no true zero point, such as temperature measurements in Celsius or Fahrenheit. Interval data analysis involves performing statistical tests such as mean calculations, variance calculation, and variance testing to analyze relationships among variables within an interval dataset, while interval-level measurement refers to quantitative data with consistent intervals.
Ratio Level Measurement
Ratio measurement incorporates all the same properties of interval measurements with an added zero point for meaningful ratios between values. Height, weight, and age variables all fall under this classification because their true zero points allow meaningful relationships among values to emerge. Ratio data analysis involves calculating means and variances and performing statistical tests on ratio data sets with constant values; ratio level measurement applies only when there's quantitative information with an absolute zero value.
Statistical Sampling Techniques
Simple Random Sampling
Simple random sampling involves selecting samples from populations in such a way that every individual stands an equal chance of selection; this technique ensures the sample accurately represents its population while eliminating bias; for instance, drawing names out of a hat could constitute such a method of random selection. It is frequently employed in surveys and experiments to ensure an accurate representation of the population within samples taken for further studies or experiments.
Systematic Sampling
Systematic sampling entails selecting every nth individual from a list of the population. It is straightforward and can provide a representative sample if ordered randomly; an easy example would be selecting every 10th employee on an employee roster as a systematic sampling method. Systematic sampling methods are widely employed by quality assurance and manufacturing departments alike to monitor production processes and ensure product quality.
Stratified Sampling
Stratified sampling involves breaking the population down into subgroups (strata) and then taking proportional samples from each stratum—this ensures that every subgroup is appropriately represented in your sample; an example would be splitting the population according to age groups and taking samples proportionately from them as one example of the stratified sampling method used by social science research to ensure all demographic groups are represented adequately within it.
Cluster Sampling
Cluster sampling entails subdividing a population into clusters and randomly selecting some clusters before sampling all individuals within those selected clusters. It is particularly effective when dealing with large populations that span a geographically dispersed space—for instance, dividing cities into neighborhoods, then randomly choosing some neighborhoods to survey as an example of the cluster sampling method. Cluster sampling techniques such as this are often used during large-scale studies in order to cut costs while improving efficiency.
If you want to learn more, you can consult our online tutors at Upstudy's Ask Tutors.
Applications of Statistics
Applied Statistics, Theoretical Statistics, Mathematical Statistics
Statistics is used in numerous fields, from practical use for practical issues to theoretical development of methods, as well as mathematical foundations. Applied statistics involves using statistical techniques to solve real-life issues in industries like healthcare, business, and engineering; theoretical techniques focus on creating innovative methods, while mathematical statistics form their mathematical basis and ensure validity and reliability—working in harmony to advance this field and expand its applications. These three branches work closely together in further developing it and broadening its applications.
Machine Learning and Data Mining
Statistics is an integral component of machine learning and data mining, providing methods for model building, prediction, and pattern recognition. Machine learning algorithms like regression, classification, and clustering rely on statistical principles when analyzing and making predictions, while data mining uses similar principles to extract useful information from large datasets using statistical techniques for pattern recognition, such as customer trend identification or preference mapping. Integrating statistics with machine learning/data mining has produced remarkable advancements in artificial intelligence research as well as data analysis techniques.
Social Statistics
Social statistics is the use of statistical methods to research social phenomena like demographics, economics, and public health. These techniques involve the analysis of survey data, census information, or any other source that provides social insight—for instance, population trends, income distribution, or health outcomes can all be studied using this type of technique. Social statistics provides essential knowledge that aids policy decisions while increasing overall well-being within societies—understanding complex social challenges like poverty, inequality, or public health challenges is made much simpler with effective analysis using these statistical approaches.
Statistical Computing
Statistical computing involves using computers and software for statistical analysis, making possible the management of large datasets and complex computations. Recent advances in computing power and software development have revolutionized statistics by making vast amounts of data quickly and accurately analyzed quickly and reliably by tools like R, SAS, and SPSS statistical software for manipulation, analysis, and visualization purposes—thus providing statisticians with tools they wouldn't otherwise be capable of undertaking themselves. Today statistical computing plays an essential part in modern data analysis by enabling statisticians to conduct sophisticated analyses that were impossible or impractical before.
Applications in Arts or Mathematics
Statistics can also be utilized in arts and mathematics for purposes beyond simple calculation of probability; examples include literary pattern analysis or studying randomness and probabilities. When applied in music, literature, visual art, etc., statistical methods provide insights into trends or influences within these artistic areas, while mathematics makes use of statistics in studying probability theory, random processes, as well as developing models of complex systems using random variables as measurements to monitor them for analysis or development purposes; applications of statistics throughout both arts and math demonstrate its versatility and wide relevance.
Frontier Research and Interdisciplinary Collaboration in Statistics
Frontier Research Areas
High-Dimensional Data Analysis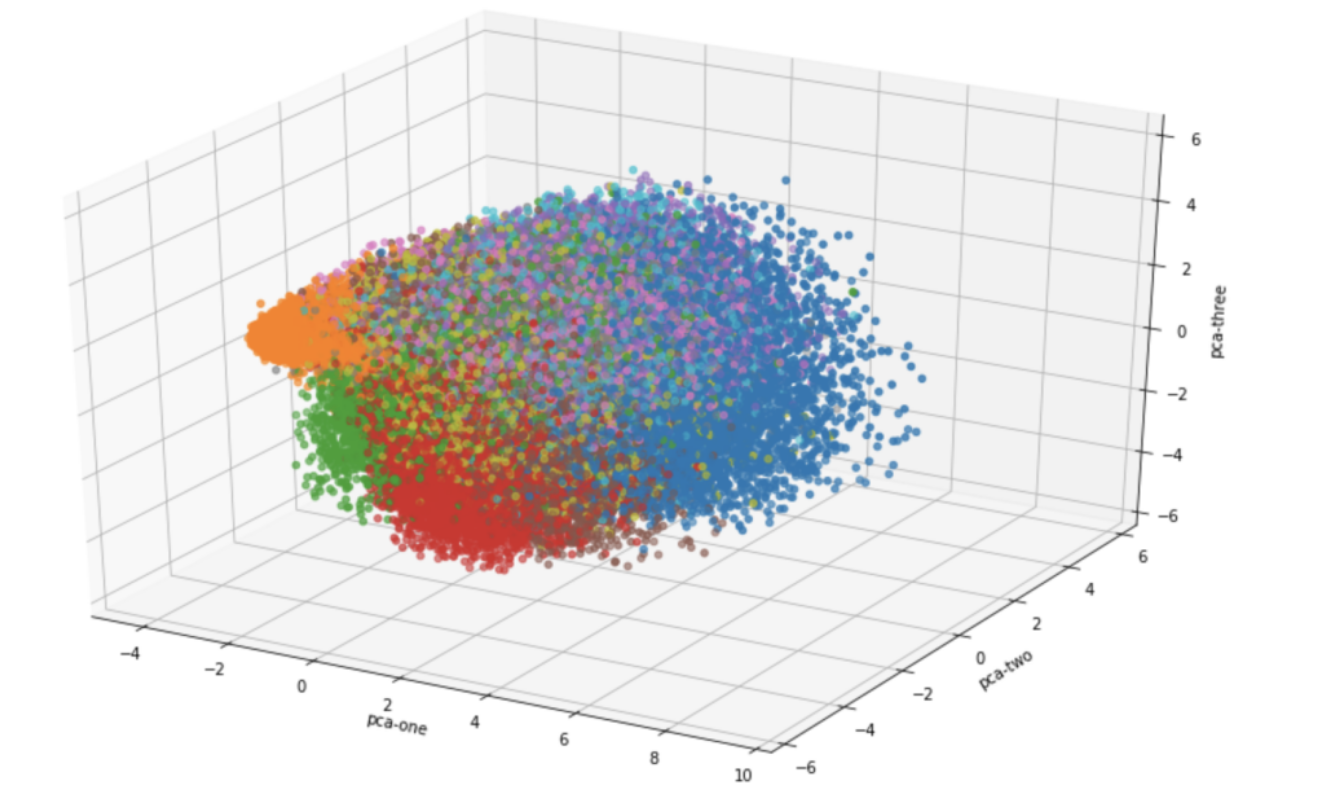
High-dimensional data analysis involves dealing with datasets with many variables and using advanced techniques to uncover patterns and relationships within them. Traditional statistical approaches frequently struggle when applied to high-dimensional datasets due to issues of overfitting and multicollinearity; more advanced strategies, like principal component analysis (PCA), regularization methods like LASSO, and machine learning algorithms are used instead. High-dimensional analysis plays an essential part in genomics, finance, and image processing fields where datasets that consist of thousands or millions of variables may exist.
Bayesian Statistics
Bayesian statistics uses probability distributions to represent uncertainty regarding model parameters while simultaneously updating beliefs based on new information. Bayesian methods differ from frequentist approaches by treating parameters as random variables with prior distributions that update with observed data to form posterior distributions—providing a flexible yet intuitive framework for statistical analysis that incorporates prior knowledge while quantifying uncertainty; widely utilized in medicine, economics, and machine learning applications.
Causal Inference
Causal inference aims to identify cause-and-effect relationships through methods like randomized controlled trials (RCTs) or observational studies, using techniques like instrumental variables, propensity score matching, or difference-in-differences; traditional statistical techniques usually identify correlations; however, causal inference seeks to establish causality, whereas instrumental variables, propensity score matching, or difference-in-differences can address potential confounding and selection bias issues. Causal inference plays an essential role in fields like epidemiology, economics, or social sciences, where understanding causal impacts from interventions/policies is vitally important, and by establishing causality, researchers can make more informed decisions and recommendations from more informed data sources than before.
Interdisciplinary Collaboration
Biostatistics and Bioinformatics
Biostatistics and bioinformatics apply statistical methods to biological data to provide greater understanding of genetic and molecular processes, aiding genetic research as well as experimental design and analysis, clinical trial design analysis, and epidemiological analyses, as well as large-scale biological data such as genomic proteomic analyses using computational and statistical techniques. Both fields play key roles in medical research advancement, treatment development, and understanding complex biological systems; statistical scientists must work collaboratively with biologists, computer scientists, and statisticians when confronted by challenges associated with analyzing and interpreting this type of information.
Reference:
Related Articles