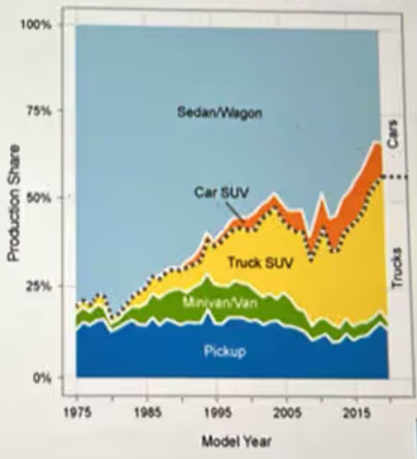
This graph, which combines the characteristics of a stacked bar chart and a line chart, shows changes in car/truck production. Which conclusion is best supported by the data in the chart?A) Consumers have always preferred trucks to cars.B) Manufacturers think sedans and wagons Sedan/Wagon are a growing market.C) Truck SUVs have become an important part of the market. Car SUVD) Truck manufacturers make more money Truck SUV than car manufacturers.
Real Tutor Solution
Quick Answer
C) Truck SUVs have become an important part of the market.
Step-by-step Solution
The graph shows the production share of different vehicle types over time. Notably, the share of Truck SUVs has increased significantly, especially from the mid-1990s onward, indicating that Truck SUVs have become an important part of the market. This conclusion is directly supported by the data shown in the chart.
Supplemental Knowledge
As with any graph that incorporates characteristics from both bar charts and line charts, when it comes to interpreting one with features of both it is crucial that one understands how all components contribute to its representation of data.
- Stacked Bar Chart:
- Shows the composition of different categories within a whole over time.
- Each segment represents a portion of the total, allowing for comparison between categories.
- Line Chart:
- Tracks changes over time for specific variables.
- The dotted lines in this graph likely represent the total production share for cars and trucks over time.
- Key Observations:
- Look at trends in each category's share over time.
- Notice significant increases or decreases that indicate shifts in market preferences or production strategies.
Applied Knowledge
Understanding combined graphs can be crucial in many fields such as business, economics and environmental sciences. Companies use such graphs to track sales performance across products lines allowing for informed decisions regarding investments or marketing strategies in the future.
Imagine yourself as the product manager at an automotive company. By studying production trends through combined graphs, you're able to discern which vehicle types are gaining in popularity and adjust production plans in response to meet market demand effectively.
Enhance your data interpretation skills with UpStudy’s live tutor question bank or AI-powered problem-solving services! Whether you're mastering graph analysis or tackling complex data sets, UpStudy offers personalized guidance tailored to your learning needs. Our expert tutors will help you excel in interpreting various types of graphs—join UpStudy today for an enriching educational experience!
For those looking to improve their proficiency in data analysis principles, explore UpStudy’s comprehensive resources on graph interpretation!
Enter your question here…
