What Is a P-Value?
Discover the role of P-values in statistics, their impact on hypothesis testing, and how they guide decision-making in research and real-life scenarios.
Sophia Greene
Feb 7, 2025 9 mins read
Data plays an essential part in our everyday lives, helping us evaluate the likelihood of various events. Xiaoming wanted to test whether the coin in his possession was indeed fair by performing an experiment: flipping it ten times. Xiaoming may begin to suspect that his coin has an inherent bias that makes 8 out of 10 spins land heads up, indicating an apparent non-randomness that cannot simply be explained as randomness. At such moments, P-value becomes a powerful and indispensable concept in statistics! The P-value allows us to quantify the probability of unanticipated outcomes or extreme situations by offering us an evaluation tool to see whether results can be attributed to randomness. By providing such an accurate measure, it helps us make more rational and informed decisions based on data. So what exactly is a P-value, why does modern statistics rely on it, and how can it guide decision-making processes? Let's dive deep.

Basic Concept of the P-value
Definition and Fundamental Concept of the P-value
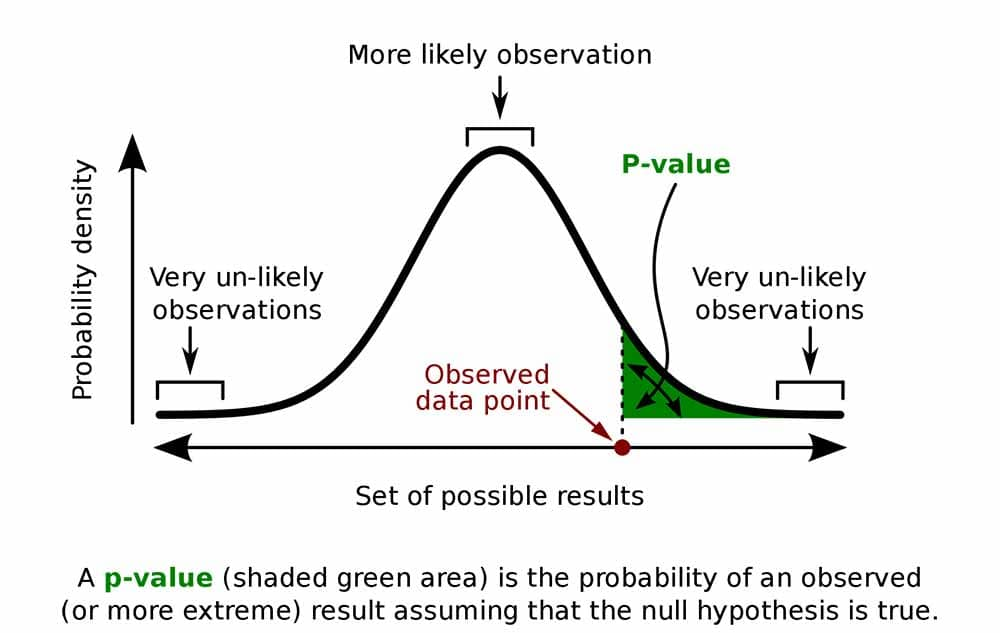
The P-value, also known as probability value, is an integral metric used in statistical hypothesis testing. It represents the risk that results as extreme or more extreme than observed ones will occur assuming that null hypothesis holds. Simply stated, the lower your P-value, the less likely it is that what was observed is due solely to random chance.
Relationship Between the P-value and Probability
A P-value is a probability measure used to gauge the rarity of data outcomes and is usually between 0-1:
Such values provide strong evidence against accepting null hypothesis; such a result under this hypothesis would almost never happen and thus suggests evidence against its acceptance.
A P-value close to 1 indicates that results under the null hypothesis are highly likely, making it hard for anyone to refute it.
Example: An Intuitive Explanation of the P-value
Imagine a classroom in which both boys and girls wear glasses from one brand with equal frequency; after randomly sampling this group, a researcher finds a slightly higher proportion of boys wearing this brand than expected from random sampling alone. After computing their P-value, this researcher determines that "if true probabilities for wearing glasses across genders were equal, such an extreme result from random sampling could only occur 3% of the time,"- which implies that boys may indeed use that brand more frequently than girls.
The P-Value and Hypothesis Testing
Null Hypothesis and Alternative Hypothesis
Definitions and Roles
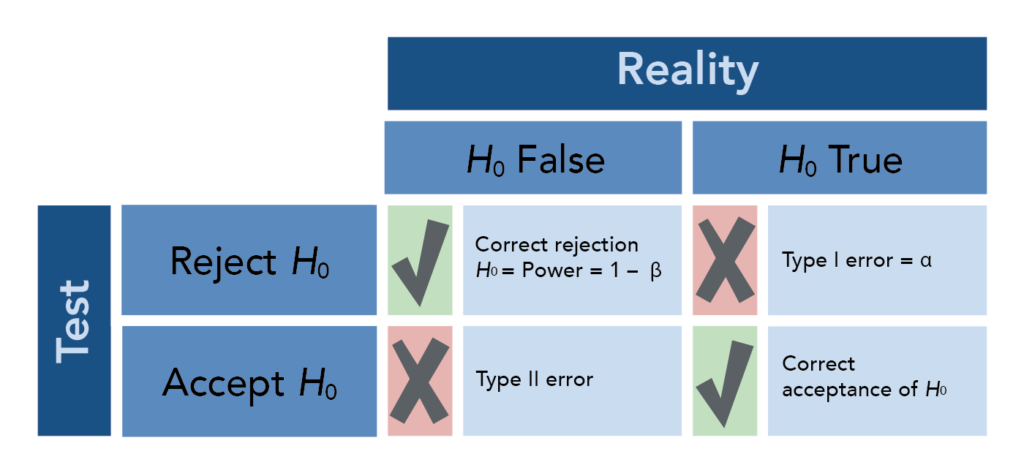
Statistics testing employs statistical hypothesis testing in which two assumptions, known as H0 (or the "default assumption") and an alternative hypothesis H1, serve to demonstrate no meaningful difference in an experiment. Statisticians then use P-value to gauge whether there is sufficient evidence against rejecting H0.
Example: when testing the efficacy of a new drug, the null hypothesis might state, "There is no significant difference in efficacy between this new medication and its predecessor," while the alternate hypothesis would propose "The new medicine is significantly more effective." Depending on experimental data analysis and calculated P-value calculations, researchers can decide whether there exists such an difference.

Role of the P-Value in Hypothesis Testing
Significance Level and Statistical Decisions
The significance level (α ) establishes the threshold for rejecting the null hypothesis. For example, if α is set at 0.05 and has a P-value smaller than this value, then the results are statistically significant, and researchers may reject their null hypothesis.
Interpretation with Different Significance Levels
Different significance levels represent different risk tolerance levels when making false conclusions. For instance, medical researchers looking at drug effectiveness might require using lower significance values (e.g. 0.01) so as to minimize any chance of inadvertently rejecting null hypotheses falsely.
Example: P-Value and Statistical Decisions
Imagine this: when conducting tests to gauge a new drug's efficacy, data analysis generates a P-value of 0.03 while the significance level (a) stands at 0.05. Since P is smaller than a, researchers conclude that their results are statistically significant and reject their null hypothesis in favor of hypothesizing that perhaps this new medicine might indeed work effectively.
How to Calculate a P-Value?
Basic Calculation Methods
Area Integration of the Probability Distribution Curve
Calculation of P-values typically relies upon statistical theory and probability distributions. Integrating areas under a standard normal distribution curve, for instance, may help in estimating probabilities associated with test statistics; such areas correspond to P-values.
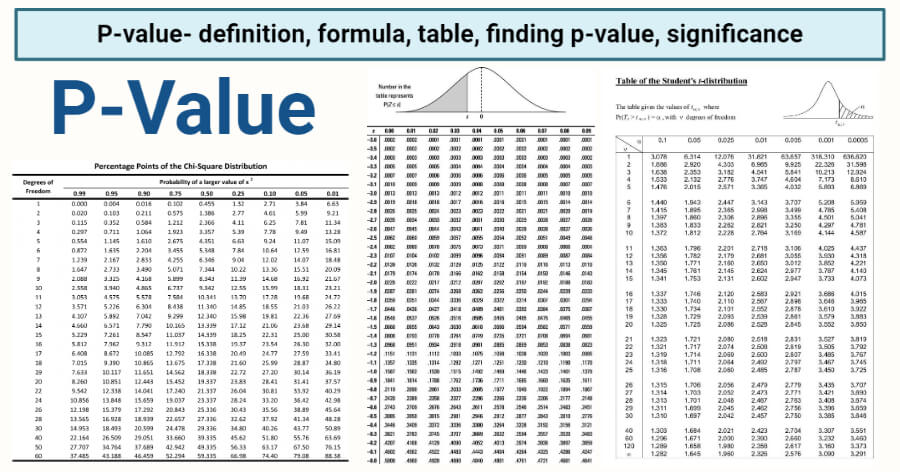
Use of P-Value Tables
Statisticians have developed standard P-value tables to facilitate quick lookup of approximate P-value ranges associated with specific test statistics (for instance, t-tests and chi-square tests). These allow quick reference when performing these common tests (including t-tests and chi-square tests ).
Software Tools and Automated Calculation
Leveraging Software Like R, Spss, Etc.
Modern statistical software has greatly simplified P-value calculations thanks to technological innovations, for instance R programming language can now perform tests and output the P-value in one line of code; making complex data analysis much more accessible and efficient than before.
Common Misunderstandings About P-Values and Correct Interpretations
Misunderstandings About P-Values
A P-Value Does Not Directly Prove a Hypothesis
An extremely small P-value does not indicate that an alternative hypothesis is indeed correct; rather, it indicates that, under the assumption of a null hypothesis, its current data are unlikely to have occurred by chance alone and do not serve as direct support for the alternative hypothesis.
Small P-Value ≠ High Confidence
Even though a low P-value provides evidence against the null hypothesis, it doesn't quantify its likelihood of being true; additional context and data validation are typically needed before reaching confident conclusions.
Tips for Correct Understanding of P-Values
Interpreting P-Values From a Probability Perspective
A P-value is an integral concept in statistics that measures the probability that current data, or something more extreme, would occur under an assumption called null hypothesis. Thus it helps evaluate randomness. A smaller P-value indicates less likely-than-expected outcomes from under the null hypothesis - encouraging further testing or revision based on this new information.
Interpreting P-Values in Real-Life Scenarios
To properly use P-values, it is imperative to consider their usage within their experimental design, sample size, and other relevant considerations. Any interpretation of the P-value in isolation from its surrounding framework must not occur.
The Relationship Between P-Values and Other Statistical Metrics
P-Values and Significance Levels (Alpha)
Definition and Setting of Alpha Levels
Alpha level or significance level serves as the maximum probability threshold used to make decisions to reject null hypotheses and suggest effects which cannot have arisen solely due to random chance. Its most frequently employed value in statistical analysis is set at 0.05; this means if P-value falls under this threshold threshold then result is considered statistically significant and therefore leads to rejection of null hypothesis and suggests unlikely causal mechanisms of observed effects.

Example: Comparison Between P-Values and Alpha
Imagine this: when investigating the efficacy of a drug, an experiment yields a P-value of 0.03 with an alpha level of 0.05; since 0.03 falls below this threshold value and thus rejects the null hypothesis thus inferring that its usage could indeed prove effective.
P-Values and Critical Values
Critical Values in Tests Such as F-Tests
Critical values play an integral part in statistical tests such as F-tests by providing benchmarks for gauging significance. When the computed F-value exceeds this critical value threshold, this signifies that any differences observed among group variances cannot have occurred by chance alone; thus helping researchers make informed decisions regarding null hypothesis testing or interventions undertaken within studies.
Example: Decisions Based on Critical Values and P-Values
Certain statistical tests, like ANOVA, which employs F-statistics, use a critical value to establish whether their results are statistically significant. When F values exceed this critical threshold, an outcome is considered statistically significant and needs to be interpreted with P values to provide an in-depth understanding of your data and accurate conclusions regarding any effects being studied.

P-Values and Statistical Significance
Judging Statistical Significance
What Is Statistical Significance?
Statistical significance measures whether an observed difference is unlikely to have arisen by random chance alone. When P-value falls under an established significance threshold (e.g. 0.05), this indicates the variation is most likely attributable to actual effects rather than random noise.
Example: Assessing Significance in Experimental Results
Imagine this: the results of a psychology experiment prove an alternative therapy effective with an overwhelming P-value of 0.01. As this threshold falls well below typical significance levels (such as 0.05), researchers might conclude there was a genuine effect from therapy, but they must remain cautious to detect possible confounding factors and potentially negative influences that might obscure any positive correlation.
P-Values and Support for Research Hypotheses
Example: Understanding How P-Values Support a Hypothesis
An important finding from one study revealed a P-value of 0.001, meaning even under the null hypothesis, 0.1% probability exists of seeing such an extreme result occurring - providing strong support for an alternative hypothesis.
Combining P-Values with Other Statistical Metrics
Though P-value is an indispensable tool in statistical analysis, using it alone may lead to misinterpretation and errors in conclusions drawn. Researchers should instead combine various metrics - effect size, experimental design quality and sample size among them - alongside P-value for more robust results.
Limitations of P-Values and Future Trends in Their Application
Limitations of P-Values
Limited Ability to Infer Causality
P-values have one key limitation that limits their usefulness; they only indicate statistical significance and cannot directly infer causal relationships between variables. Even in observational studies where small P-values may indicate statistical significance, this does not ensure accurate causal conclusions.

Influence of Sample Size on P-Values
Large sample sizes often lead to extremely small P-values, which could simply reflect increased statistical power rather than their practical significance. Thus, it is imperative that effect sizes be taken into account alongside P-values when conducting statistical analysis.
Future Trends and Advances in P-Value Application
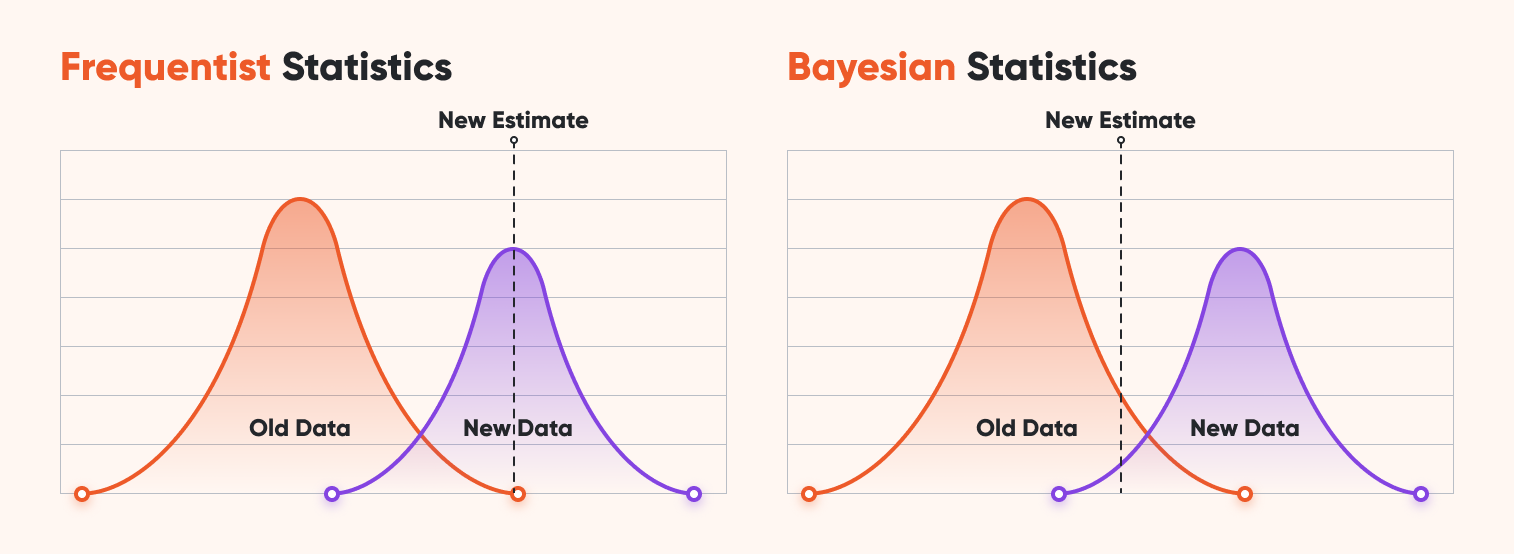
Integration with Bayesian Statistical Methods
An increasing number of researchers are employing Bayesian posterior probability analysis in addition to P-values in their evaluation processes. This provides more nuanced analyses when it comes to judging the credibility of hypotheses over traditional significance testing alone.
Adjustments for Multiple Testing to Enhance Interpretation
Researchers who conduct multiple hypothesis testing, such as genetic research, often turn to Bonferroni adjustments as a way of altering their P-value threshold and decreasing false positive rates while improving credibility of findings and setting higher standards for understanding P-values.
Real-World Case Studies of P-Values
Example: Investment and Comparing Market Benchmarks
An example from our question bank: an investor claiming that their portfolio compares favorably to an S&P 500 market benchmark, for instance. After conducting statistical analysis on this assertion, researchers arrive at a P-value of 0.02 which falls beneath the significance level of 0.05 and thus provide meaningful insight for further investment decisions.
Example: Applications of P-Values in Scientific and Medical Research
P-values play an essential role in the medical evaluation of new drugs. After conducting clinical trials, researchers may find that one group shows a significantly greater cure rate than its control group, yielding a P-value of 0.001. This suggests that there was only a 0.1% chance under the null hypothesis that such data existed and strengthens evidence for effective new medications. This result firmly supports their claim.

P-values, an essential tool in statistical analysis, offer researchers a quantitative measure of data outcomes' significance. However, over-reliance on P-values for decision-making may lead to misinterpretations or overlooking important aspects of study design. Going forward, integration of other statistical techniques-such as effect size measures, Bayesian approaches and multiple hypothesis corrections-will become key elements in improving statistical analyses' scientific rigor and precision. Understanding and correctly using P-values are integral parts of data-driven decision-making in scientific research projects, investment analysis, and medical applications. Understanding and using P-values appropriately is integral in making data-driven decisions!
reference:
https://en.wikipedia.org/wiki/P-value
Related Articles