How to Calculate Probability?
Discover how to calculate probability with ease! From basic concepts and formulas to real-life applications, learn to make informed decisions in uncertain situations.
Alice Brooks
Jan 24, 2025 11 mins read
What is Probability?
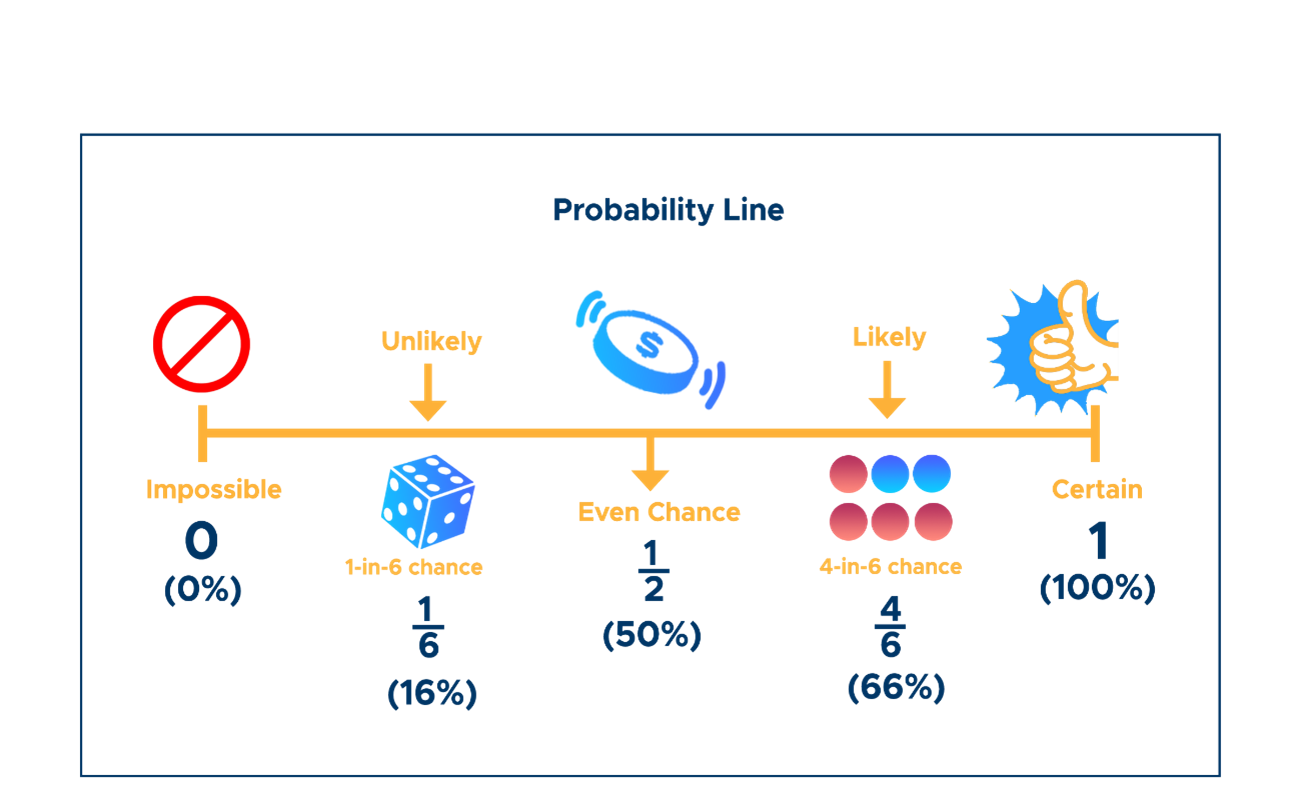
Defining Probability
Probability measures the likelihood that something will happen and is expressed as a number between 0 and 1. 0 indicates impossibility, while one means its certainty; flipping a fair coin yields odds of landing heads equaling 50%, for instance.
The formula to calculate the probability is simple:
P(Event)=Favorable Outcomes/Total Possible Outcomes
Here, "favorable outcomes" refers to the outcomes we are interested in, while "total possible outcomes" accounts for all outcomes that could occur.
Basic Elements of Probability
Outcomes
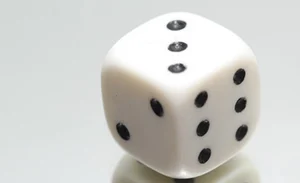
These represent all the potential outcomes of an experiment. For example, when rolling a standard six-sided die, the outcomes could be 1, 2, 3, 4, 5, or 6.
Event
A desired subset of outcomes. For example, rolling a 5 on the die constitutes an event.
Sample Space
All the outcomes are possible in a given experiment.
Take a deck of cards, for instance:
The sample space includes all 52 cards.
The event could be drawing an Ace, which offers favorable outcomes of 4.
Why Understanding Probability Matters
Probability applies far beyond dice rolls or card games. It has many applications in multiple areas, including
Risk Management - for calculating insurance premiums according to accident likelihood;
Medicine - diagnosing illnesses using predictive probabilities from test results;
AI and Machine Learning: Estimating probabilities with predictive algorithms.
Mastery of probability goes far beyond theoretical exercises: it equips you with skills for critically examining scenarios and making informed decisions.
Calculating the Probability of Single Events
Calculating the probability of single events involves following a straightforward, three-step process.
Step-by-Step Calculation
Step 1: Define the Event
Identify what outcome you're focusing on. For example, if you're rolling a standard die and want to know the likelihood of rolling a 5, the event is "rolling a 5."
Step 2: Determine Total Possible Outcomes
Look at the experiment's sample space. With one roll of a six-sided die:
The possible outcomes are 1, 2, 3, 4, 5, and 6.
Total outcomes = 6.
Step 3: Apply the Probability Formula
Now calculate:
P(Rolling a 5)=Favorable Outcomes/Total Possible Outcomes=\(\frac{1}{6}≈0.1667\)
Example:
If you want the probability of flipping heads in a coin toss, there is 1 favorable outcome (heads) out of 2 possible (heads and tails). Thus:
P(Heads)=\(\frac{1}{2}=0.5\)
Common Mistakes to Avoid
Beginner learners frequently make errors in identifying favorable or total outcomes:
Forgetting all possible outcomes- for instance, in card deck problems, failure to take suit into consideration as part of an outcome.
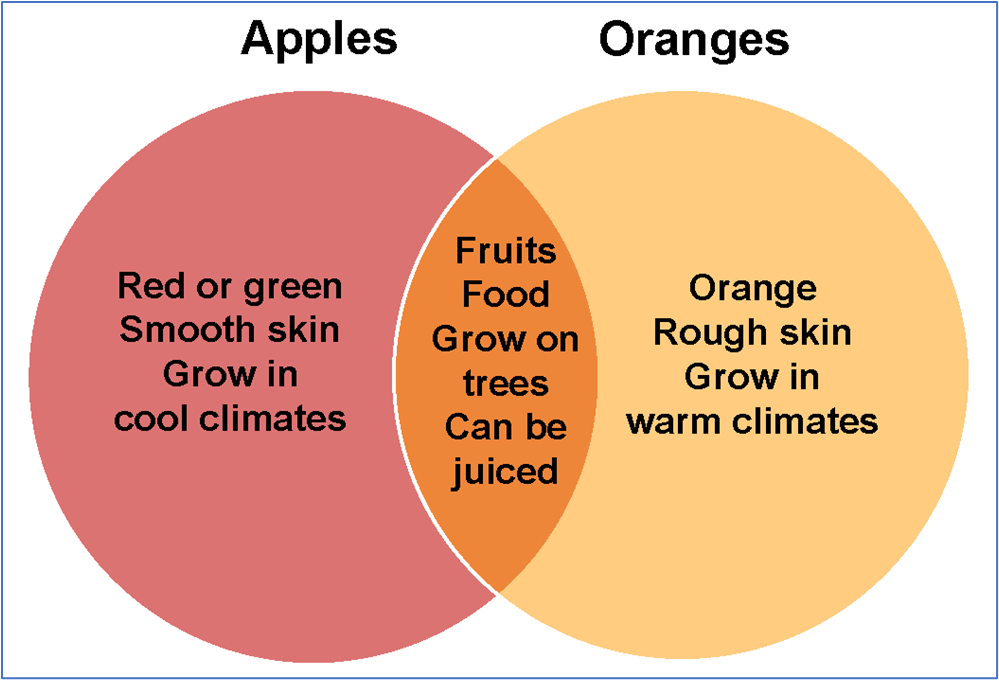
Assuming mutually exclusive events when outcomes may overlap -- for instance, when calculating probabilities for red Queens without considering overlaps between red cards and Queens-- can lead to some confusing results. Visual aids like Venn diagrams or probability tables may prove effective solutions to address these.
Visualizing Events Using Diagrams
For single-event problems, diagrams can help. For instance:
Bar Chart Example: Depict the frequency of each side of a die in repeated rolls to solidify an understanding of equal probabilities.
Simple Venn Diagram: If rolling a die for numbers greater than 3, visualize overlaps between {4, 5, 6} and other event subsets, if any.
Probability for Multiple Events
Real-world scenarios often involve multiple events occurring together or in sequence. For such cases, you need additional tools.
Independent Events
If the outcome of one event doesn't affect the other, they are independent.
Example: Rolling a die and flipping a coin.
Formula:
P(A and B)=P(A)×P(B)
Scenario:
What's the probability of flipping heads and rolling a 6?
P(Flipping heads) = 1/2
P(Rolling a 6) = 1/6
P(Heads and 6)=\(\frac{1}{2}×\frac{1}{6}=\frac{1}{12}\)

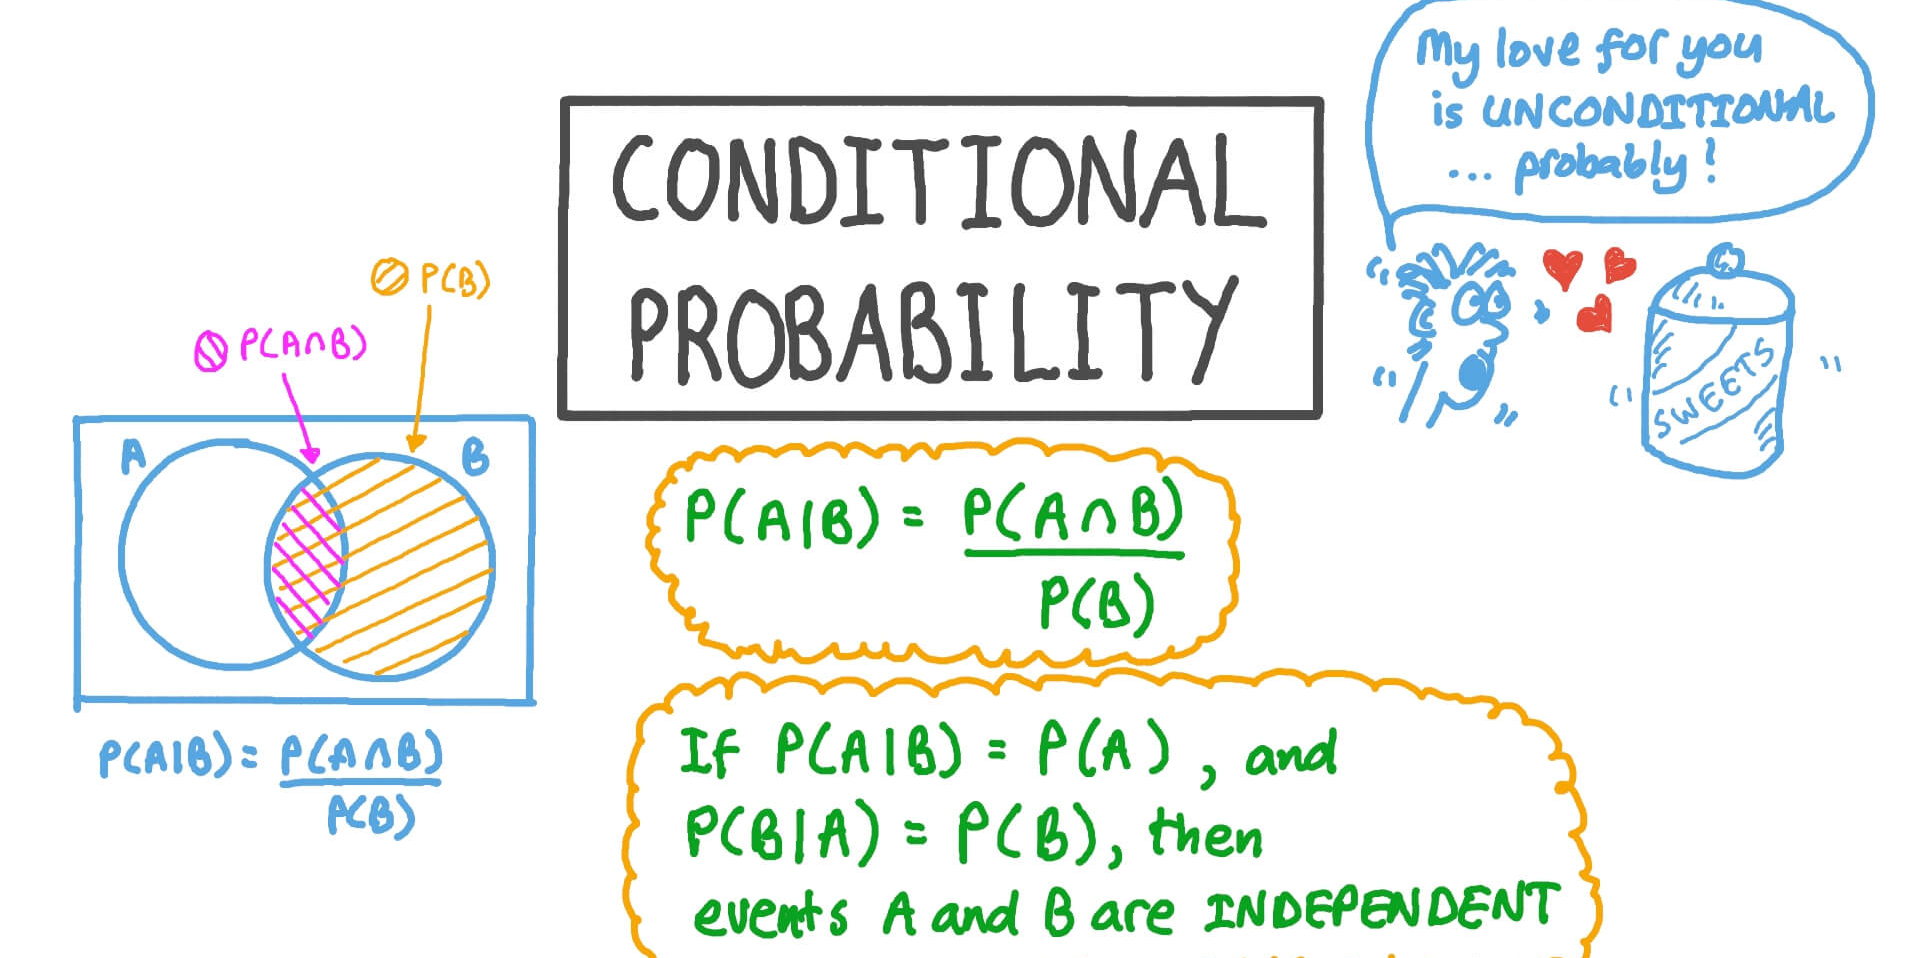
Dependent Events
With dependent events, the outcome of one affects the probability of the other.
Example: Drawing cards from a deck without putting them back.
Formula:
P(A and B)=P(A)×P(B∣A)
Here, P(B|A) represents the probability of B given that A has happened.
Scenario:
The likelihood of drawing two Aces in a row from a shuffled deck:
P(Drawing first Ace) = 4/52
P(Drawing second Ace) = 3/51 (since one Ace is already removed)
P(Two Aces)=\(\frac{4}{52}×\frac{3}{51}=\frac{1}{221}\)
Combined Events: OR and AND Rules
Mutually Exclusive Events:
If two events can't occur simultaneously:
P(A or B)=P(A)+P(B)
Non-Mutually Exclusive Events:
If events can overlap:
P(A or B)=P(A)+P(B)−P(A and B)
Scenario:
In a deck of cards, what's P(Drawing a King or a Spade)?
P(King) = 4/52
P(Spade) = 13/52
P(King and Spade) = 1/52 (King of Spades)
P(King or Spade)=\(\frac{4}{52}+\frac{13}{52}−\frac{1}{52}=\frac{16}{52}=\frac{4}{13}\)
Event Trees for Multiple Scenarios
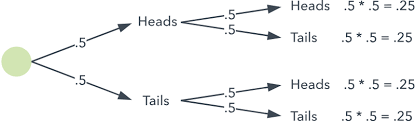
To visualize multiple events, use event trees, which map out scenarios from one branch. For instance:
Path 1 (Heads, Heads): P=0.5×0.5=0.25
Path 2 (Heads, Tails): P=0.5×0.5=0.25, and so on.
Real-Life Applications of Probability
Probability isn't just a theoretical concept confined to textbooks or classrooms. It plays an integral role in various real-life situations, helping to make decisions, predict future events, and manage risks.
Everyday Scenarios Where Probability is Useful
Let's explore practical applications where probability is at work:
Weather Prediction
Meteorologists use probability to forecast weather, such as a "30% chance of rain." This percentage is calculated using historical data and atmospheric models to assist people in planning their day.
Traffic and Navigation Apps
Google Maps and Waze use probability theory to forecast congestion; their algorithms estimate traffic delays based on millions of user experiences.
Healthcare
Medical tests produce probabilistic outcomes. For instance, the sensitivity of COVID PCR tests provides insight into the likelihood that they will yield a true-positive diagnosis given positive test results.
Sports Analysis
Probability-based analytics are widely used to calculate a team's chances of winning based on past performance, weather conditions, or player statistics.
Gamification of Probability Concepts
Probability's real-world appeal can even be found in games:
Card Games: Poker demonstrates concepts like independent events (shuffling cards) and conditional probabilities (inferring other players' hands based on dealt cards).
Board Games: Monopoly involves decision-making by estimating probabilities of landing on specific squares.
Dice-Based Games: In Yahtzee, players estimate the likelihood of rolling combinations like three-of-a-kind.
These games not only entertain but also offer hands-on learning opportunities, teaching us how probabilities apply to strategic thinking.

Analyzing Common Distributions: Beyond Basic Probability
Probability distributions offer a deeper look into how outcomes are spread out across a range of possibilities. Let's explore some common types that go beyond the basics:
Importance of Probability Distributions
Probability distributions show how probabilities are allocated over the outcomes of a random variable. These models allow us to evaluate varying conditions and make predictions in complex contexts such as psychology, physics, and finance.
Normal Distribution (Gaussian Curve)
The normal distribution, commonly called the bell curve, is essential in statistics because of its symmetry and consistent behavior. It shows that most data points will cluster around the mean, while fewer extreme data points appear towards the tails.
Example: SAT scores follow a normal distribution, with most students scoring near the average but fewer achieving very high or very low marks. If the mean SAT score is 1050 with a standard deviation of 100, approximately 68% of students will score between 950 and 1150.
Binomial Distribution
The binomial distribution focuses on repeated trials with two outcomes, such as success and failure.
Example:
Flipping a coin 5 times:
Success = "getting heads."
Trials = 5 flips.
P(Heads) = 1/2.
The binomial distribution predicts the likely number of successes in a set of trials.
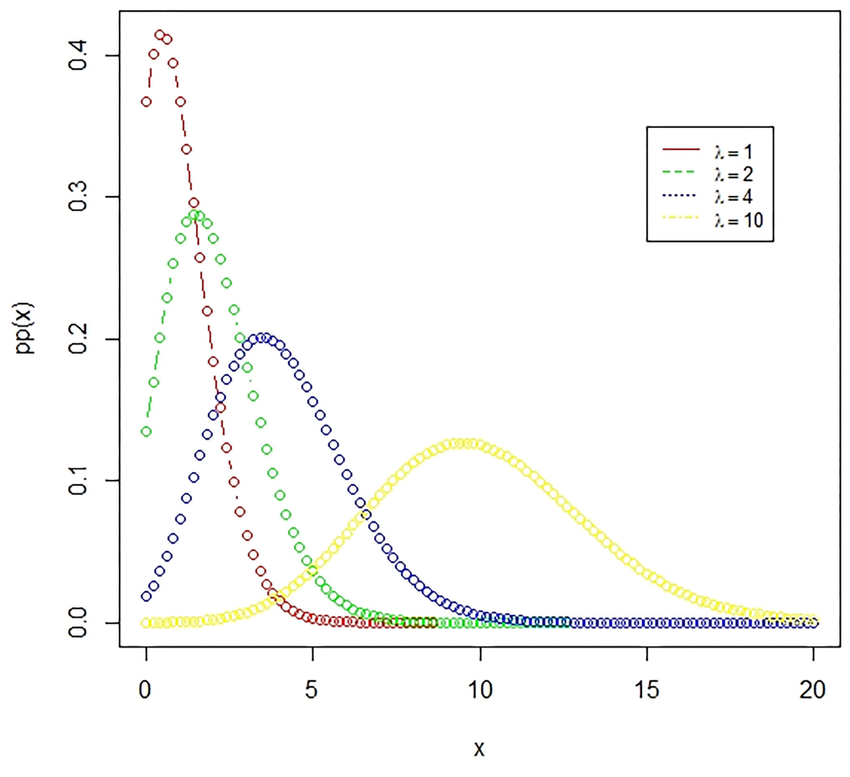
Poisson Distribution
Poisson distributions can be used to model how often an event happens in an interval of time or space, for instance how many customers arrive during one hour based on historical trends. A restaurant might use Poisson distribution to predict such numbers of arrivals using historical trends as an example.
Probability distributions provide us with invaluable tools for understanding complex systems, giving us insights that are invaluable for data analysis, risk management and more.
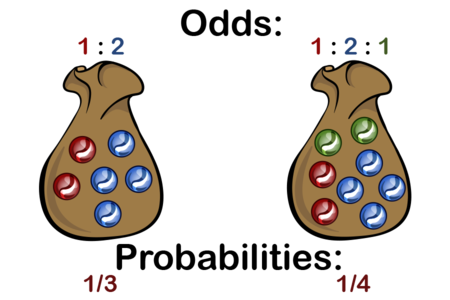
Advanced Topic: Converting Odds into Probabilities
Understanding the difference between odds and probabilities is integral for working in areas like sports betting or statistical modeling, so let's dive deeper and discuss ways of converting between them.
Odds vs. Probabilities
Odds: Expressed as a ratio of favorable outcomes to unfavorable outcomes.
Example: The odds of rolling a specific marble are 11:9 (11 favorable, 9 unfavorable).
Probability: Expressed as a fraction or percentage of favorable outcomes compared to total outcomes.
Step-by-Step Conversion
Writing Odds as a Ratio
For the above example, odds = 11:9. This means:
Favorable outcomes = 11.
Unfavorable outcomes = 9.
Summing Values to Get Total Outcomes
Total outcomes = Favorable + Unfavorable = 11+9=20.
Applying the Probability Formula
P(Event)=Favorable Outcomes/Total Possible Outcomes
Thus:
P(Event)=\(\frac{11}{20}\)=0.55 or 55%.
Reverse Calculations: From Probabilities to Odds
What if you start with a probability and need to express it as odds? Invert the process:
subtract one from your probability value so as to see unfavorable outcomes;
convert your probability number into the ratio between favorable and unfavorable outcomes, etc.
Example: If P(winning)=0.4:
Unfavorable probability =1−0.4=0.6.
Odds =4:6 or simplified, 2:3.
Strategic Problem Solving with Probability
One of the most important aspects of probability is learning how to approach problems systematically, especially when dealing with complex scenarios.
Recognizing Problem Types
Problems in probability typically fall into specific categories:
Single events: Straightforward calculations.
Combined events: Using AND/OR rules for multiple events.
Conditional probability: Adjusting probabilities based on an initial outcome.
Example:
You're asked what the likelihood is of picking a red king from a deck of shuffled cards. Recognizing this as a single-event problem will immediately guide you to apply the fundamental formula:
P(Red King)=Favorable Outcomes(2)/Total Possible Outcomes(52)=\(\frac{1}{26}.\)
Using Probability Maps
Probability Maps offer an innovative method for solving probability issues by organizing events and outcomes into tree-like structures, visually representing events with associated probabilities and visually representing how events develop over time.
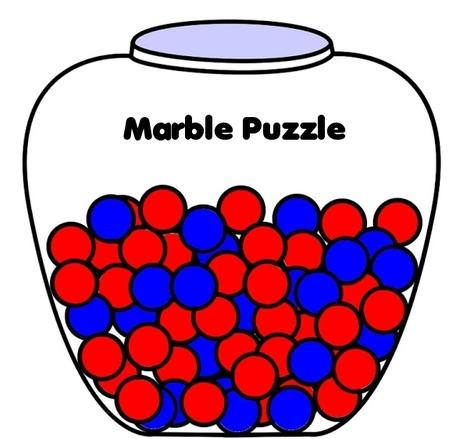
Scenario: A bag has 3 red marbles and 2 blue marbles. What's the probability of drawing two reds without replacement?
Draw first red: P=3/5.
Draw second red: P=2/4.
Map It!: Create branches for red and blue outcomes to intuitively trace calculations.
Common Pitfalls in Probability and How to Avoid Them
Probability can be deceptively tricky, and many learners—both beginners and experienced—fall into common traps. This section highlights frequent errors and offers strategies to steer clear of them.
Errors in Adding or Multiplying Probabilities
One of the most frequent mistakes is incorrectly choosing between addition and multiplication rules.
Addition Rule Pitfall:
Students often add probabilities when events are independent, e.g., by flipping heads twice.
Correct Approach: Multiplication applies here:P(Heads, then Heads)=P(Heads)×P(Heads)=\(\frac{1}{2}×\frac{1}{2}=\frac{1}{4}.\)
Addition Rule Correct Usage:
Add probabilities only for mutually exclusive events, e.g., "What's the chance of rolling a 5 or a 6 on a die?"
P(5 or 6)=P(5)+P(6)=\(\frac{1}{6}+\frac{1}{6}=\frac{2}{6}\).
Forgetting Conditional Probability Adjustments
Conditional probabilities, particularly in situations without replacement, often confuse learners.
Example: Picking two red marbles from a bag of 3 red and 2 blue marbles without replacement requires recalculating the total outcomes for the second event:
P(Second Red | First Red)=\(\frac{2}{4},not \frac{3}{5}\).
Solution: Lay out the sample space visually (e.g., event trees) to account for changing totals.
Misinterpreting Odds and Probabilities
Odds and probabilities are different, but many learners mistakenly interchange them. For instance, if the odds of winning are 5:3 (5 favorable outcomes for every 3 unfavorable), the probability would be:
P(Win)=\(\frac{5}{5+3}=\frac{5}{8}\),
not 5/3.
Verification While Solving
Introduce the concept of verifying your solution by tracing calculations backward.
Example: If the final probability for an event doesn't add up to values between 0 and 1, retrace the logic back through assumptions and formulae.
By identifying these normal stumbling blocks and taking preventive steps like using tools, double-checking with formulas, and breaking problems into smaller parts, you can master even complex probability calculations confidently.
Practice and Exercises for Mastering Probability
Mastery of probability comes with practice. Problems ranging from simple calculations to advanced applications help solidify concepts and enhance problem-solving abilities.
Step-by-Step Guided Problems
Problem 1: Single Event
Scenario: You roll a six-sided die. What is the probability of rolling a number greater than 4?
Solution:
Favorable outcomes: 5, 6 (2 outcomes).
Total outcomes: {1, 2, 3, 4, 5, 6} = 6.P(Greater than 4)=Favorable Outcomes/Total Possible Outcomes=\(\frac{2}{6}=\frac{1}{3}\).

Problem 2: Combined Events (AND Rule)
Scenario: You flip a coin and roll a die. What are the chances of getting heads on a coin flip and rolling a 3 on a six-sided die?
Solution:
P(Heads) = 1/2.
P(Rolling a 3) = 1/6.
Events are independent:
P(Heads AND 3)=P(Heads)×P(3)=\(\frac{1}{2}×\frac{1}{6}=\frac{1}{12}\).
Conclusion
Probability may initially seem intimidating, but once its core principles are grasped, it becomes an invaluable resource, from estimating single events' probabilities to taking on complex real-world situations with confidence and making informed decisions using probability. By breaking problems down into manageable steps using formulae or event trees to make your analysis simpler, you'll soon become adept at managing even complex situations confidently.
Probability has become an integral component of everyday life - from game prediction and data analysis, to making everyday decisions, or simply understanding probability better as part of life in general. With practice and exposure in various contexts, probability quickly become something practical that people use intuitively rather than as abstract mathematical theory.
Mastering probability requires more than solving equations; it's about developing an approach to understanding and navigating an uncertain world. With patience and practice, anyone can harness the potential to reason critically and make confident decisions. Happy calculating!
Reference:
https://www.linkedin.com/pulse/quantitative-risk-management-tools-techniques-monday-utomwen
Related Articles